
Data Visualization
Chart Styles and Usage
Overview
Charts and graphs give us a way to visualize data that would otherwise be consumed in grid or list form. It gives us a great opportunity to empower our user’s to make better informed business decisions.
Structure & Layout
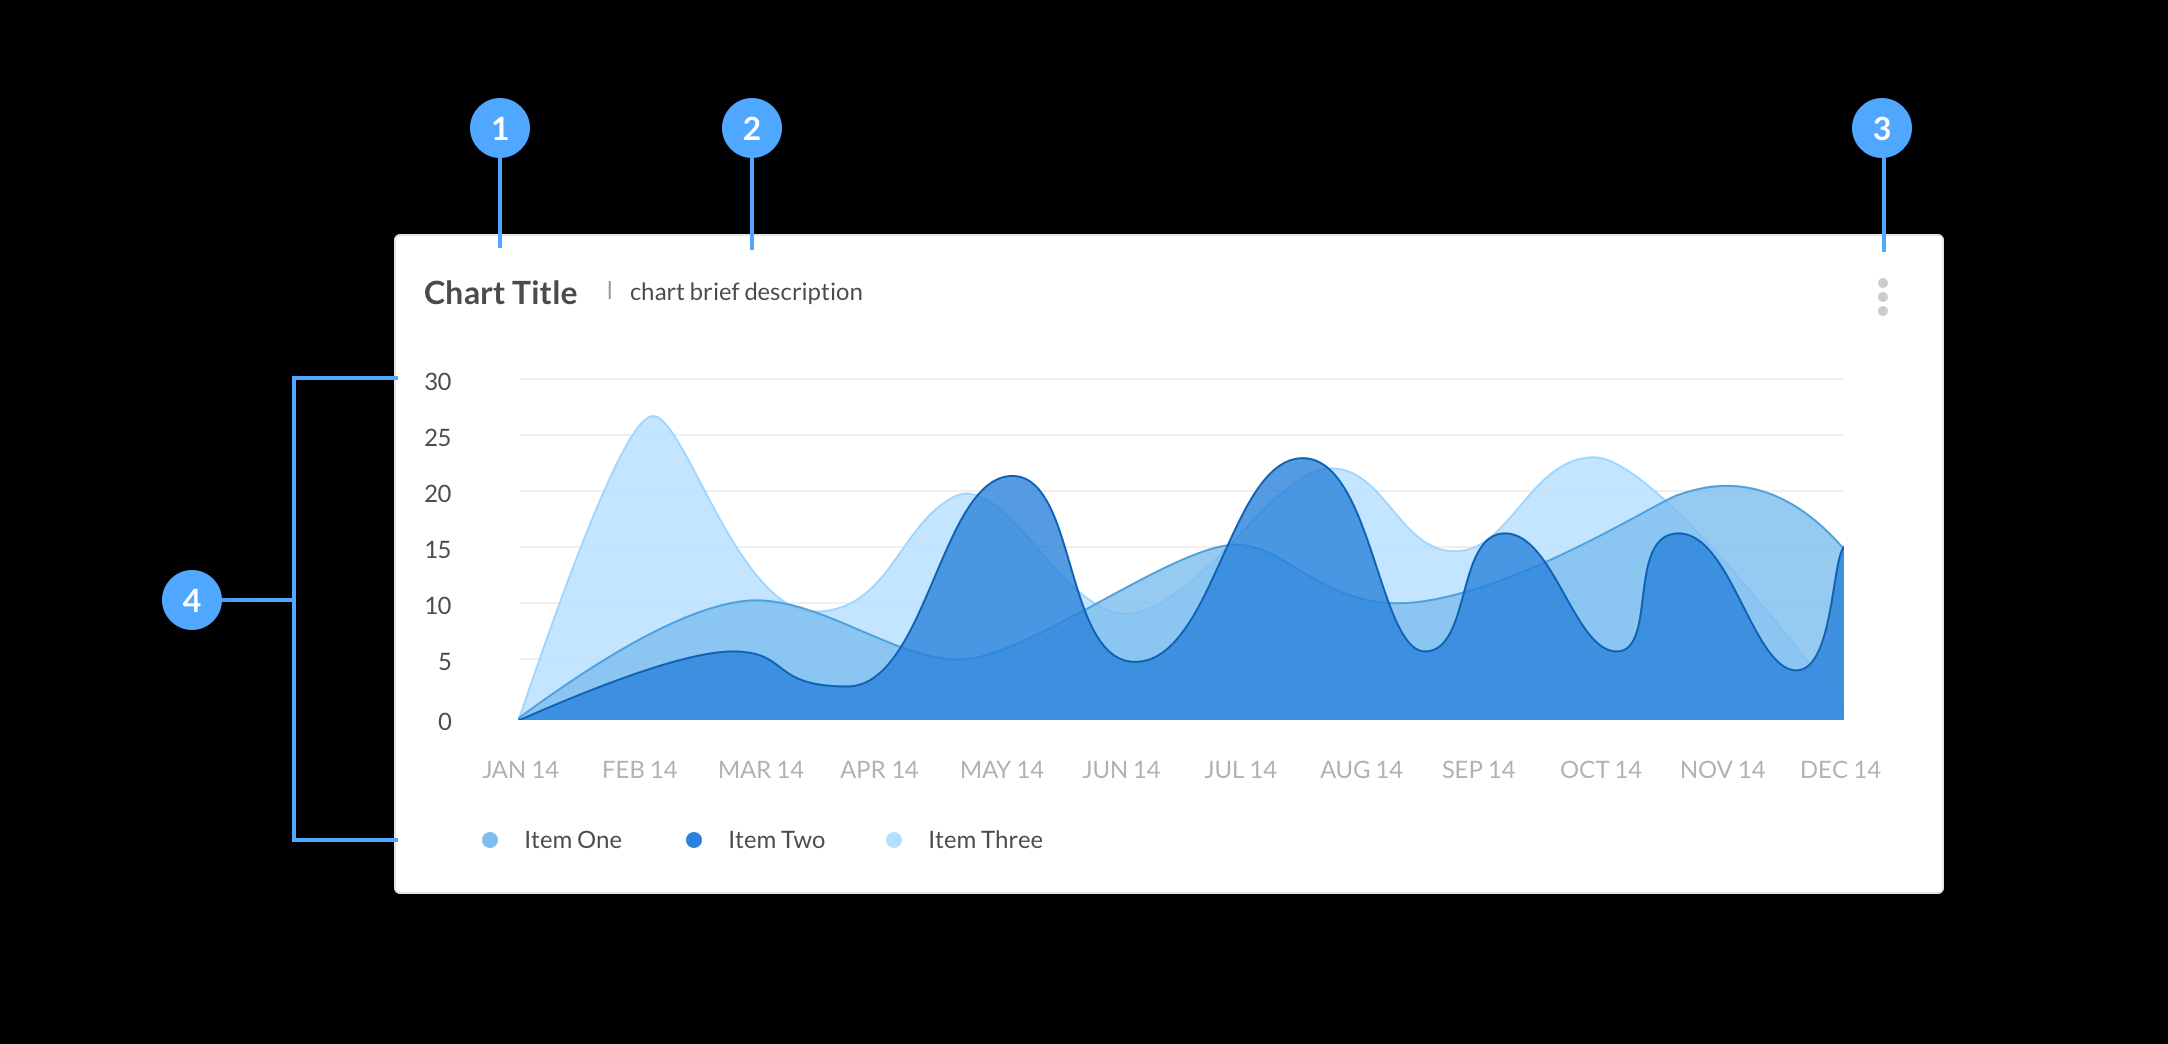
Data visualizations are most often consumed on dashboards, but we do have some cases where a chart can be added to a stand alone view to enhance the user experience for that view. Below is our standard data visualization widget structure.
Title
Titles are required and should be descriptive but short.
Short Description
Any time we can add additional context to a visualization we should do so. However, we realize this is not always necessary or available. So for that reason, short desciptions are optional but highly encouraged.
Context Menu
Like many of our widgets our data visualization widget comes with an optional context menu. This menu is a dropdown button that can give the user access to additional actions such as, exporting or deleting or modifying the widget data.
Visualization Area
Below the title, short description and context menu is where we add the visualization. This ensures that on any device size the title comes before the visualization. A visualization could be a graph, table or diagram.
Examples
Horizontal Bar Chart
Active users the past 90 days grouped by territory
Horizontal Stacked Bar Chart
Active users the past 90 days grouped by territory
Line Chart
Annual spend per division
Area Chart
Active users the past 90 days grouped by territory
Vertical Bar Chart
Breakroom fruit contributions by employees
Stacked Vertical Bar Chart
Breakroom fruit contributions by employees
Pie Chart
Active users the past 90 days grouped by browser
Doughnut Chart
Active users the past 90 days grouped by browser
Bubble Map Chart
Active users the past 90 days grouped by country
Color Palette
Our visualization colors are based off our primary blue #0575e6. We have a color palette for our developers to download that has been generated from our Primary Blue color that has 60 colors in it.
Download Color PaletteOur visualization colors are based off our primary blue #0575e6. We have a color palette for our developers to download that has been generated from our Primary Blue color that has 60 colors in it.
Download Color Palette